Work

Roles, newest first, each with the case studies that came out of it.

Experience

  1. March 2023 – Present

    Sr. Product DesignerPitchBook

    I lead the design system at PitchBook, a platform serving 100,000+ clients. Each designer here owns an area; mine was dashboards, navigation and profiles, where I led design of four market dashboards that replaced an unused home page. I also consolidated 56 Figma libraries into one system now used by 10 active teams, built Design Studio (an AI prototyping tool), and made the VC Exit Predictor, PitchBook’s AI forecasting tool featured in TechCrunch, explain itself.

  2. October 2022 – February 2023

    Product DesignerQuantified AI

    I led design of an AI role-play simulator for Novartis, which had to onboard 150+ sales specialists in nearly half the usual time without more trainers. With the AI team, I turned coaching rubrics into feedback tied to each scenario.

  3. May 2022 – August 2022

    Product Design InternSiriusXM Pandora

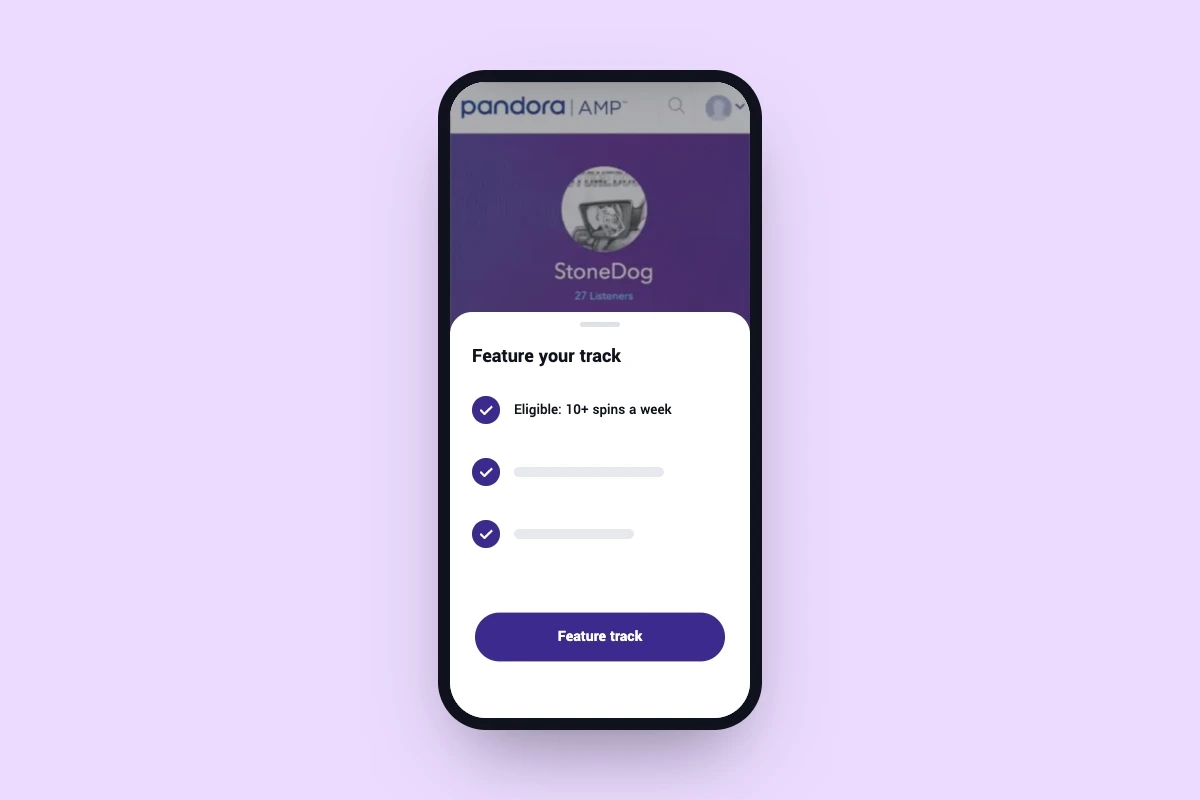
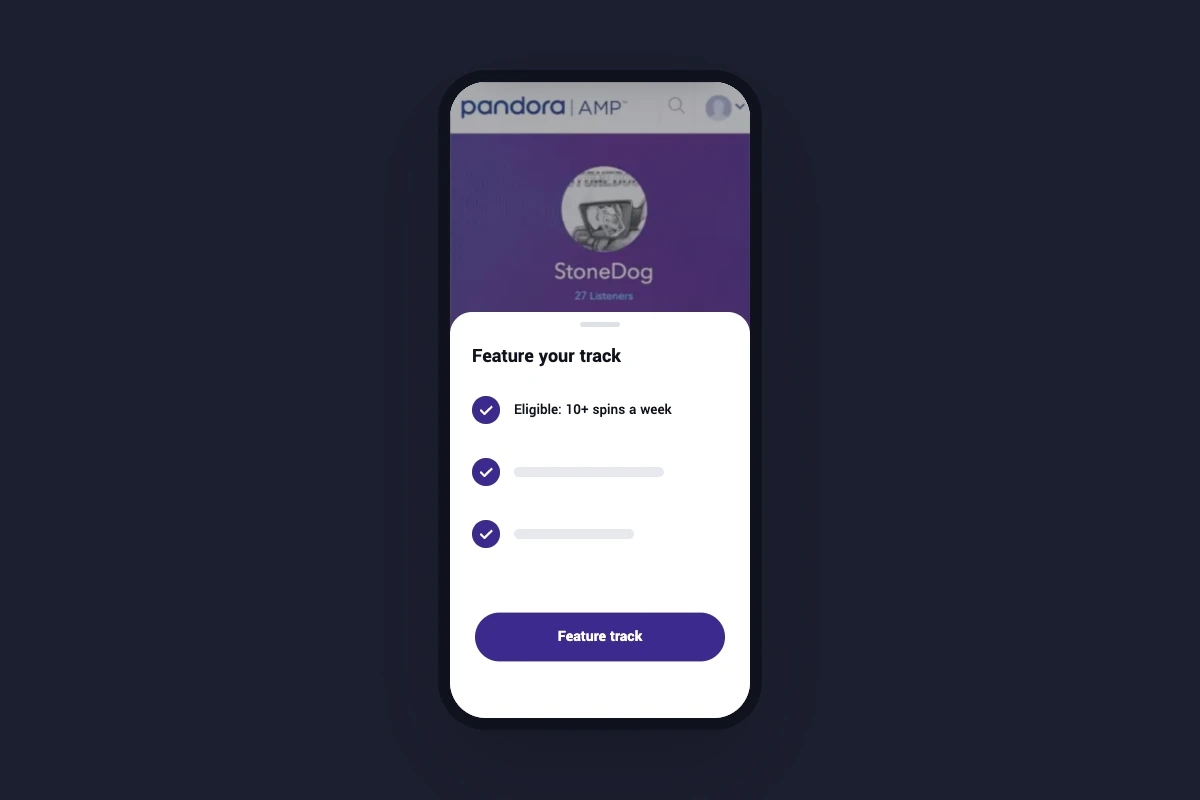
    I proposed and designed “It’s Time”, a mobile flow on Pandora’s AMP that prompts artists to feature a track once it qualifies, and handed it to the AMP mobile team for development.

  4. July 2018 – August 2021

    Freelance UX DesignerScrunch, DesignAR, Eiosys

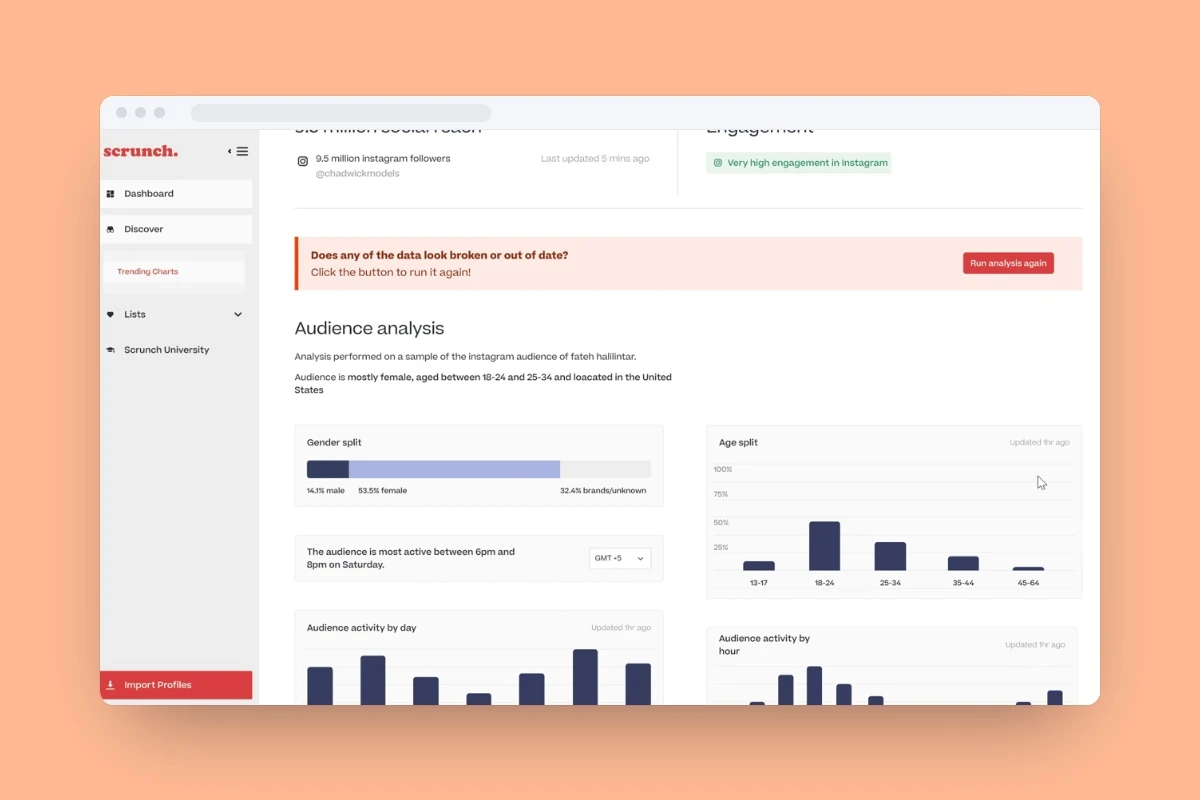
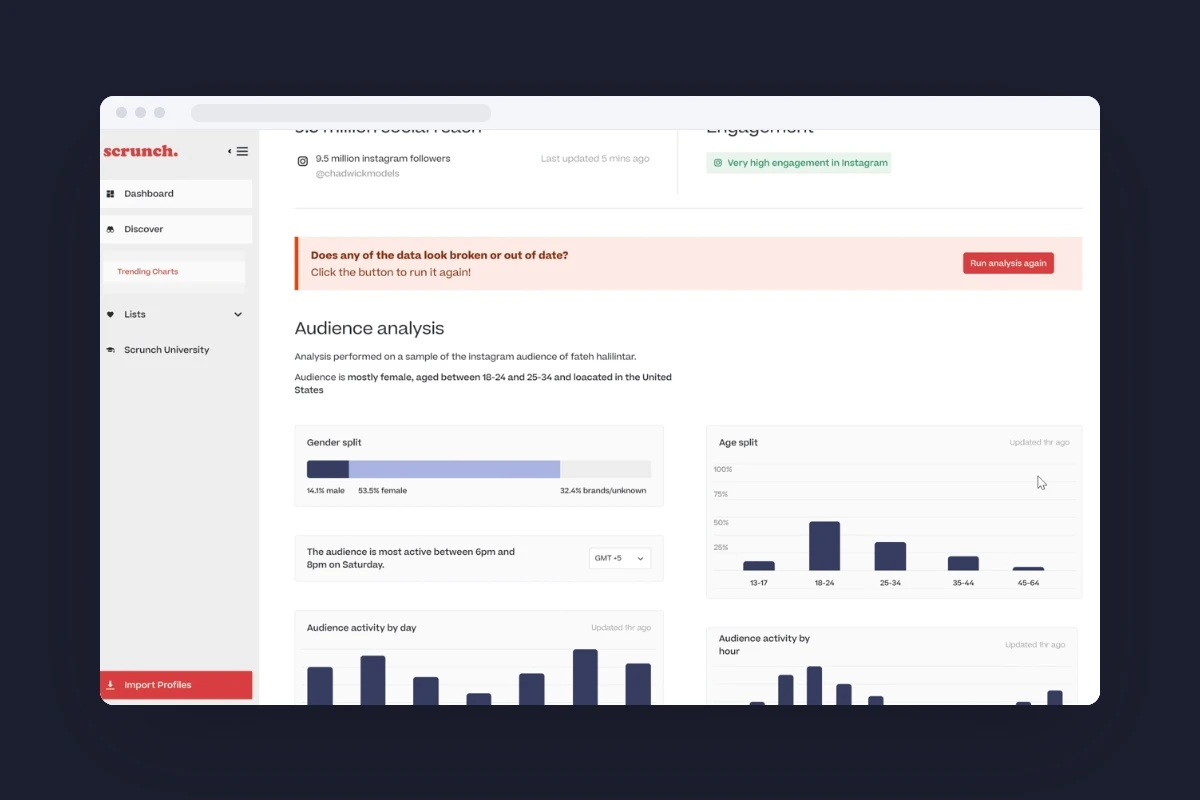
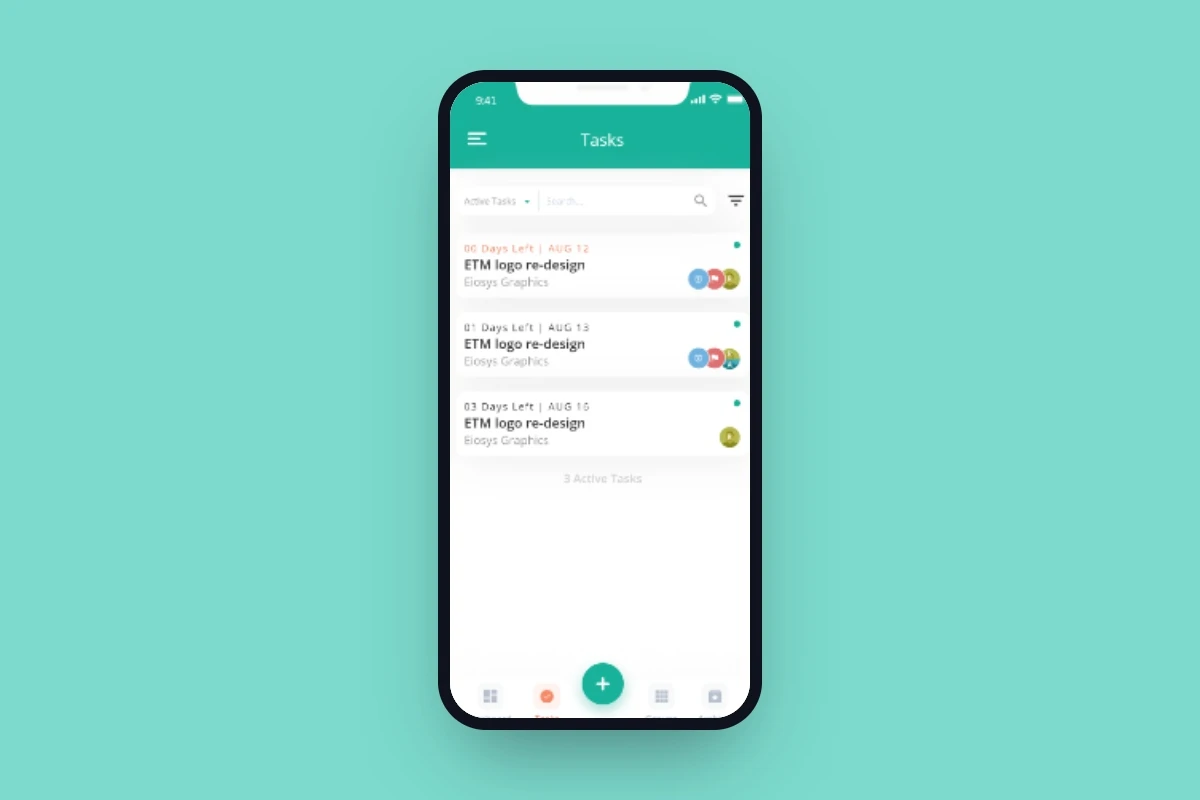
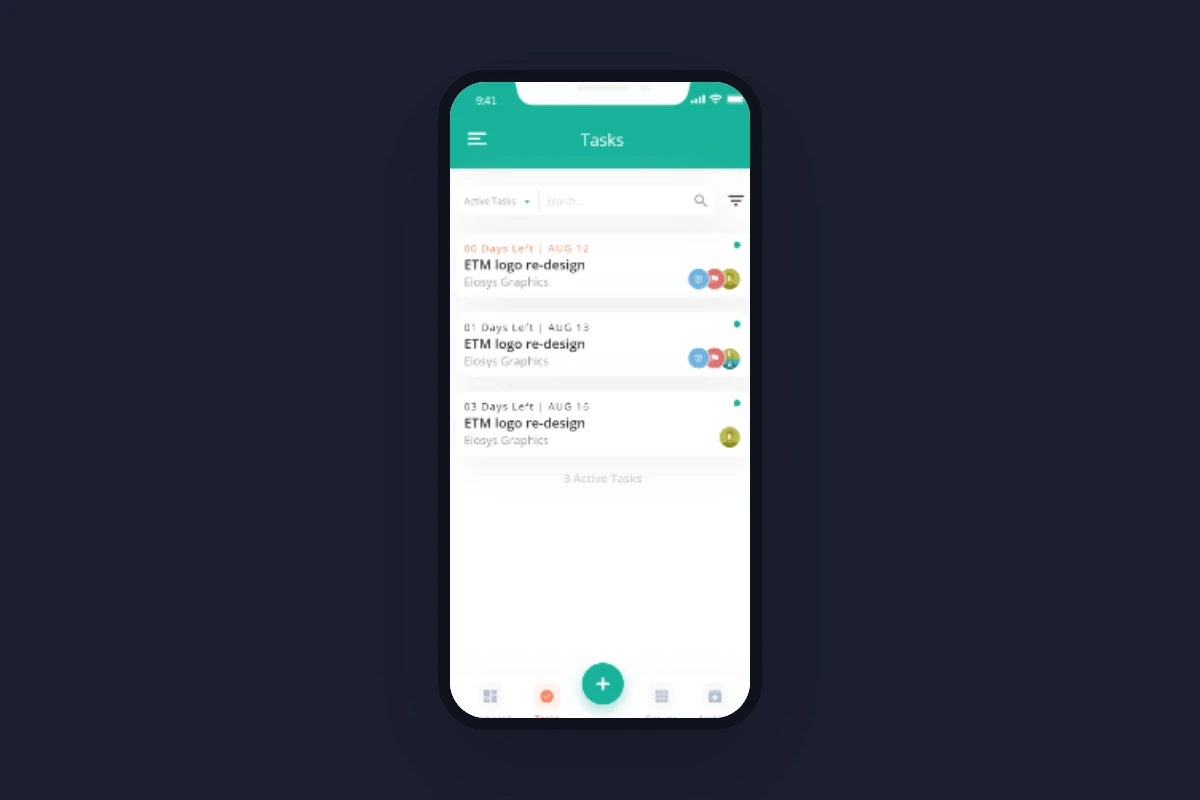
    I rebranded and redesigned Scrunch, an influencer marketing platform with 20M+ profiles, working with its team in Brisbane. The new identity and platform lifted trial-to-paid conversion by 56%. I also did fashion tech work for JJ Valaya, featured in Vogue.

  5. August 2019 – March 2021

    Co-Founder & COOBotonomics

    As co-founder, I set design strategy across branding and product, took directions through to final details, and planned and structured deliverables.

  6. 2018 – 2021

Private study · Preview

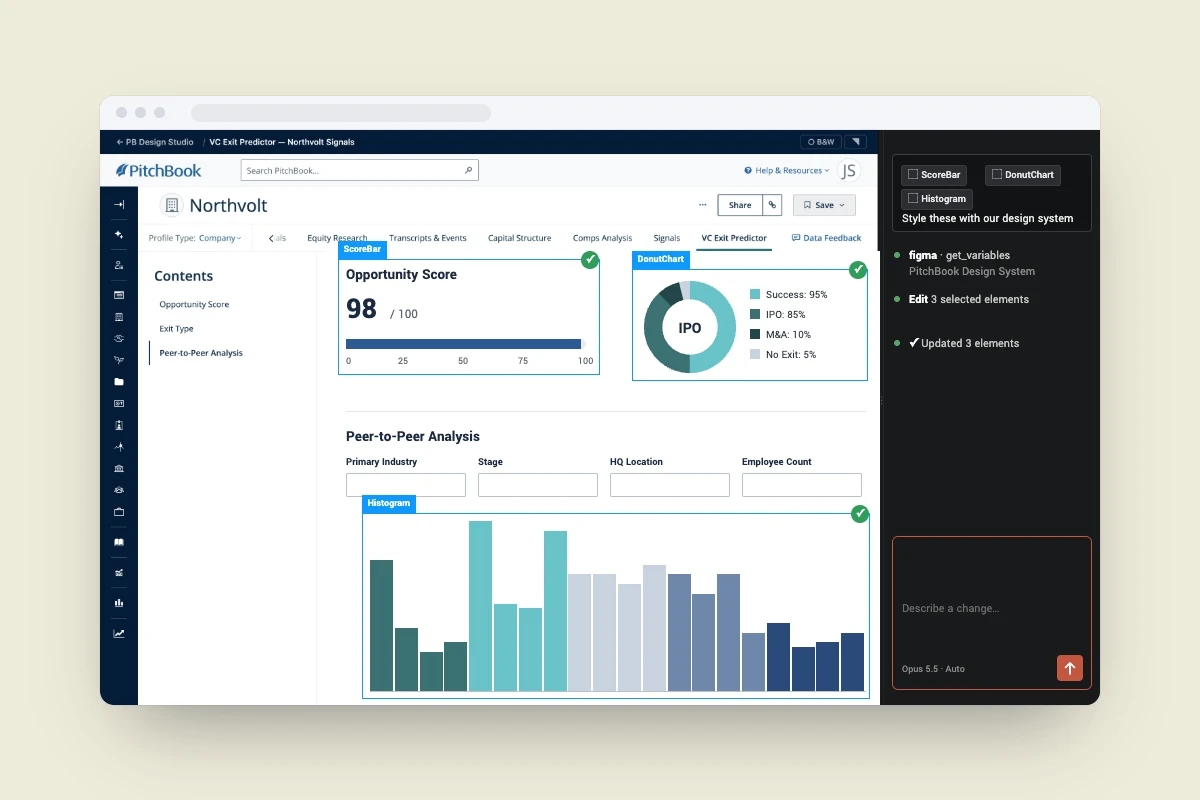
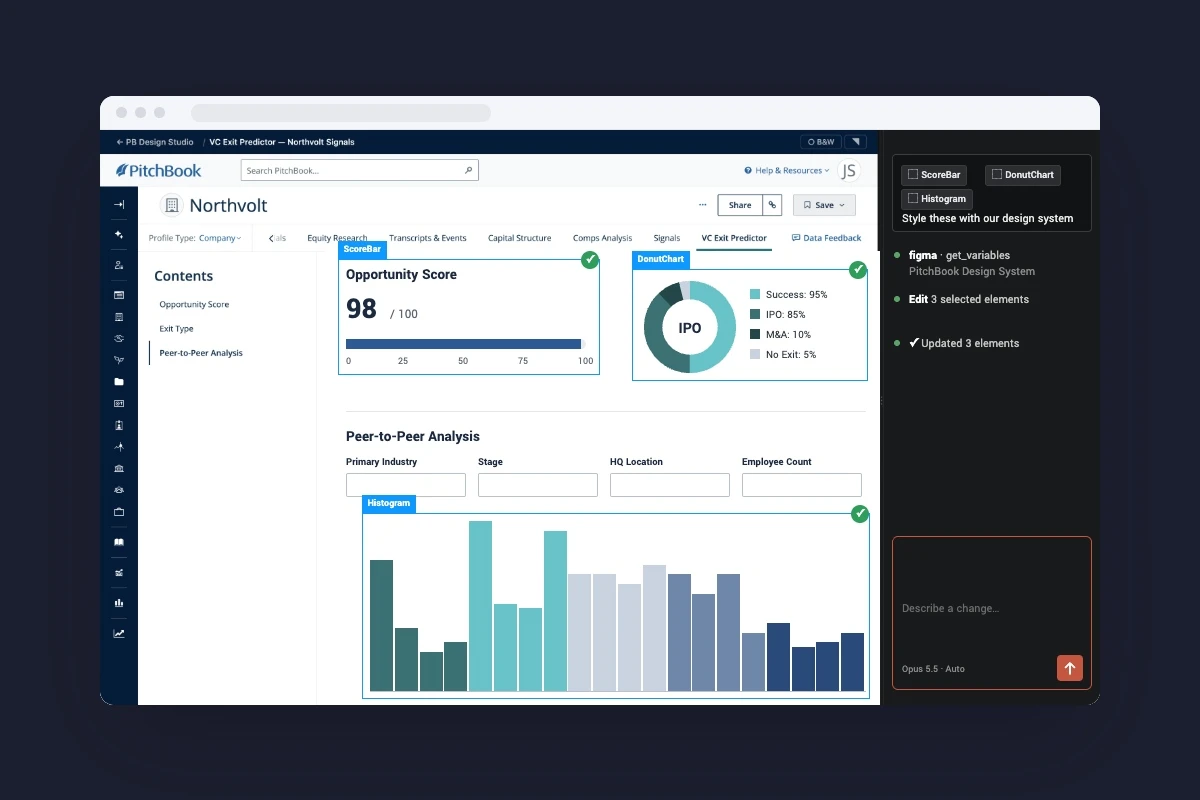
Library cards from the Figma archive, each in its own drifting blue, merge into one PitchBook Design System library; its variables open; then in Design Studio, selected elements take on those tokens from a Claude Code promptLibrary cards from the Figma archive, each in its own drifting blue, merge into one PitchBook Design System library; its variables open; then in Design Studio, selected elements take on those tokens from a Claude Code prompt

PitchBook, 2025 – Present

From 56 libraries to AI prototypes on real components

I consolidated 56 Figma libraries into one token-based system and built Design Studio, an AI tool that prototypes with PitchBook’s real components. I also lead the documentation.

Role
Sr. Product Designer, design systems lead
Team
A PD2 on my team, front-end platform engineering (about 8 engineers), PitchBook’s design team
Timeline
2025 – Present
Scope
Tokens, documentation, and AI tooling for a 90+ component system

The problem

The design system had splintered into 56 disconnected Figma libraries. Consistency slipped, theming and accessibility were close to impossible, and design intent got lost between Figma and code.

The outcome

One token-based system now runs across PitchBook’s product teams, documentation is being rebuilt for people and AI tools alike, and Design Studio spread from design to product, engineering and leadership.

Key decisions

  1. Two token layers, not one exhaustive map

    I dropped my first model, one exhaustive token map, because every change rippled through it. Instead I consolidated the libraries onto two token layers: core foundations named by role and emphasis, plus scoped tokens for high-variability components. Dark mode, accessible contrast and brand theming became settings.

  2. Treat documentation as infrastructure

    A clean system fails if nobody knows how to use it, people or AI. I audited the whole kit, decided what earns its own doc, and shipped the most-used components first, with docs synced to Storybook where both read them.

  3. Prototype with the real kit, not a lookalike

    Design Studio lets a designer describe a page and get a working React prototype built from PitchBook’s real UI kit. I built rather than bought: off-the-shelf builders can’t be given a private kit. It’s scoped to prototyping, and Figma stays the source of truth.

  4. Share one repo, hide the Git

    The hard part was a way of working a whole team could share: personal branches and folders, shared templates on main, and an agent that handles Git so designers never type a command. Anyone can contribute a template or skill back.

The full study adds

  • Product screens
  • Research behind each decision
  • Trade-offs
  • Results

Private study · Preview

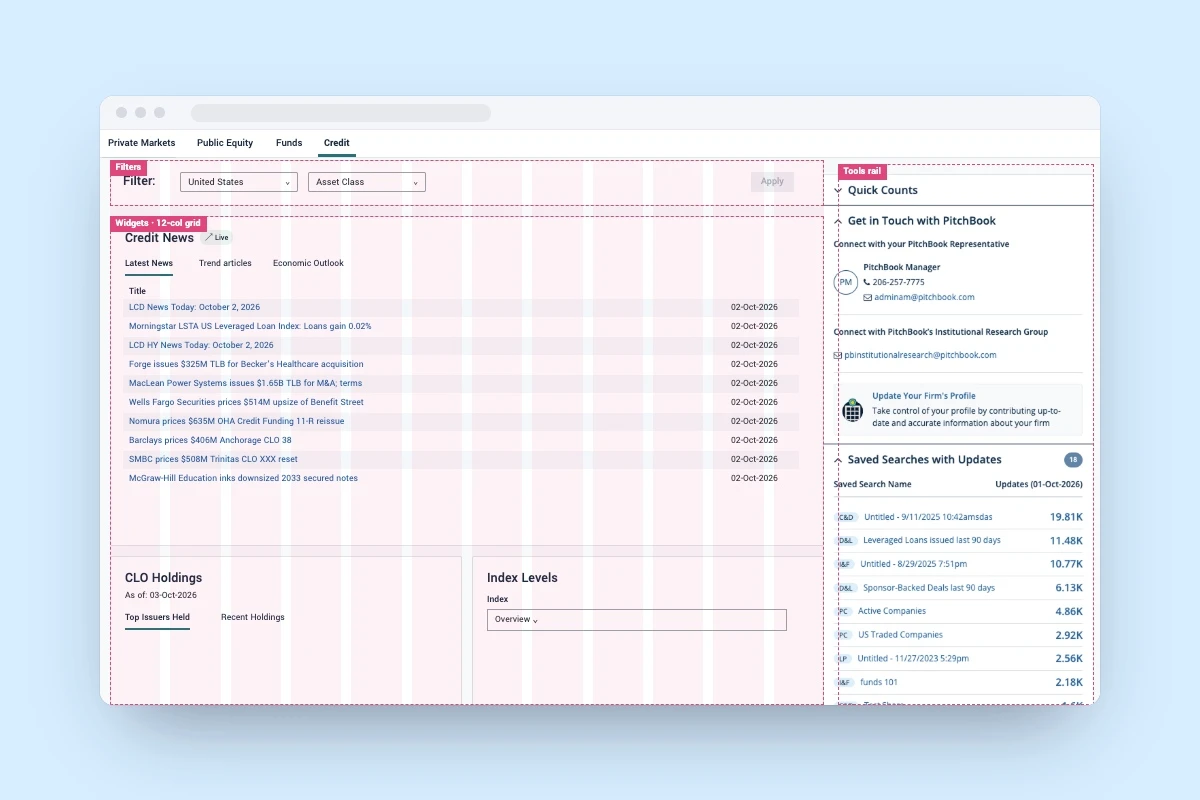
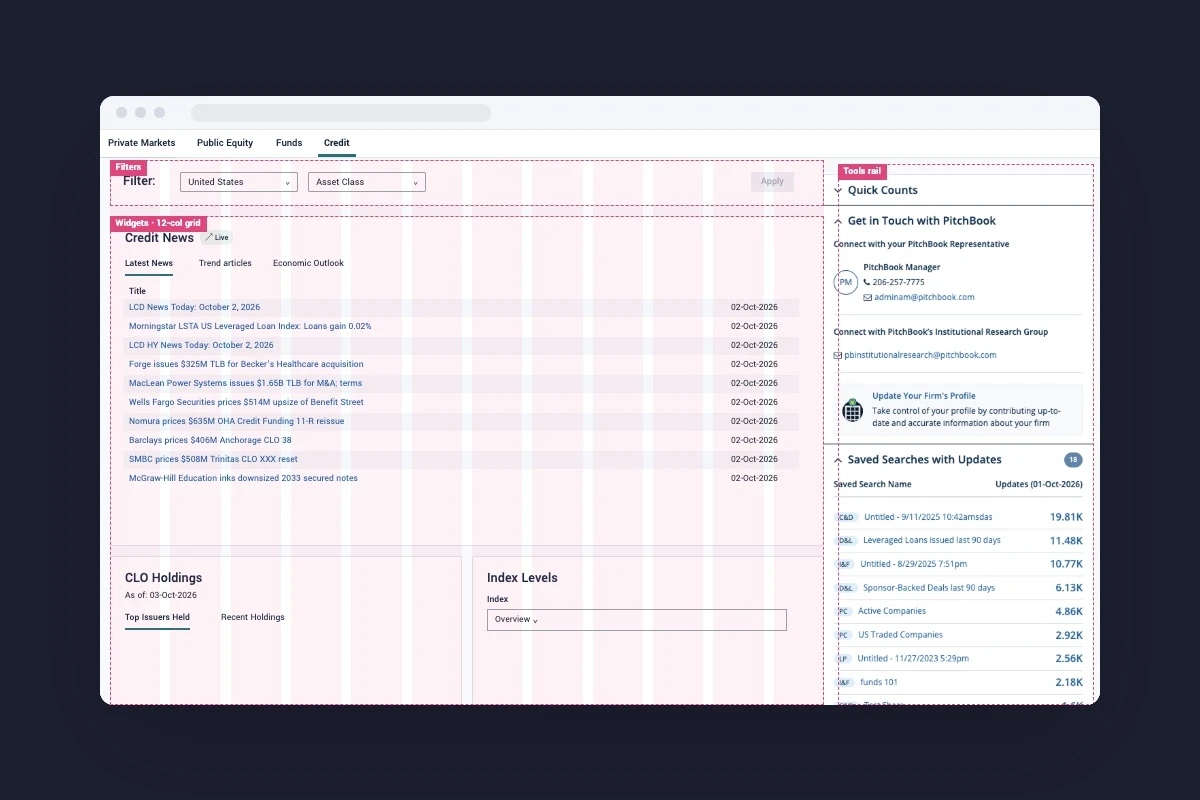
The PitchBook dashboard re-flowing for Private Markets, Public Equity, Funds and Credit, each labelled with its organizing model, then a grid overlay showing the shared anatomyThe PitchBook dashboard re-flowing for Private Markets, Public Equity, Funds and Credit, each labelled with its organizing model, then a grid overlay showing the shared anatomy

PitchBook, 2024 – 2025

An unused home page, replaced by four market dashboards

I led design of four market dashboards on one shared system, replacing a PitchBook home dashboard that almost nobody used.

Role
Sr. Product Designer, design lead for the market dashboards
Partners
Product, engineering, and data across 7 product teams, and Morningstar (PitchBook’s parent company)
Timeline
2024 – 2025
Scope
4 market dashboards · ~70 widgets

The problem

PitchBook’s home dashboard was the first screen every user saw, and almost nobody used it. Built for venture investors and corporate teams, it sent everyone else straight to search.

The outcome

Four market dashboards on one shared system retired the legacy home page and beat its click-through. They became how sales shows each client their part of PitchBook, and how customer success onboards.

Key decisions

  1. Hand off to tools, don’t rebuild them

    A dashboard shouldn’t compete with the platform it sits on, so most widgets hand off to PitchBook’s existing tools instead of rebuilding them. Going deeper means leaving the dashboard, but it stays light enough for many teams to add to without fragmenting the product.

  2. Four market dashboards, not one customizable one

    Funds, Private, Public and Credit each start from how that market works, from deal sourcing to news-first credit tracking. I chose market-specific dashboards over full customization.

  3. No generic empty states, one shared anatomy

    On a data product an empty box reads as bad data, so no widget ever shows a generic “no data” box. All four share one anatomy (filters, core data and a right rail) while the layout flexes per market.

  4. Scale through a guide, not through me

    Several product teams own widgets, so I wrote a self-service design guide covering anatomy, grids and quality. Engineering uses it too, catching drift and bringing system changes to design. Anything that introduces a new pattern still comes through design review.

The full study adds

  • Product screens
  • Research behind each decision
  • Trade-offs
  • Results

Private study · Preview

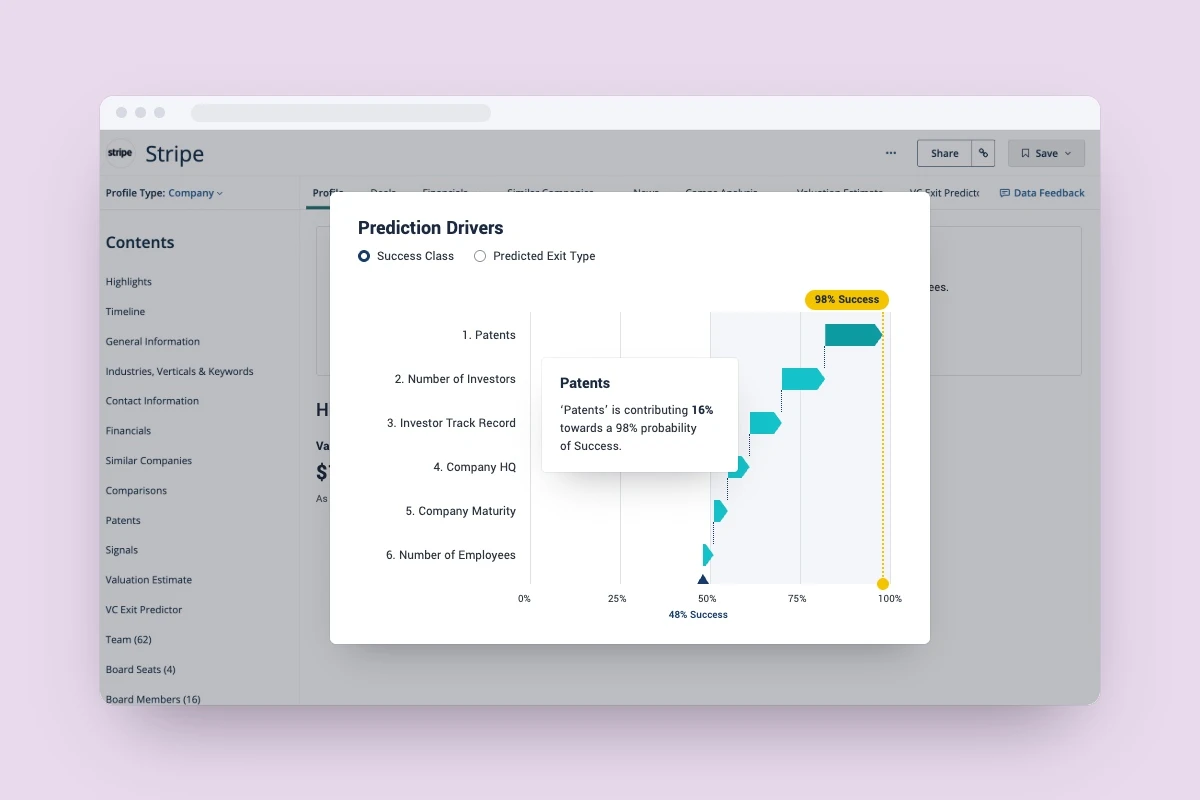
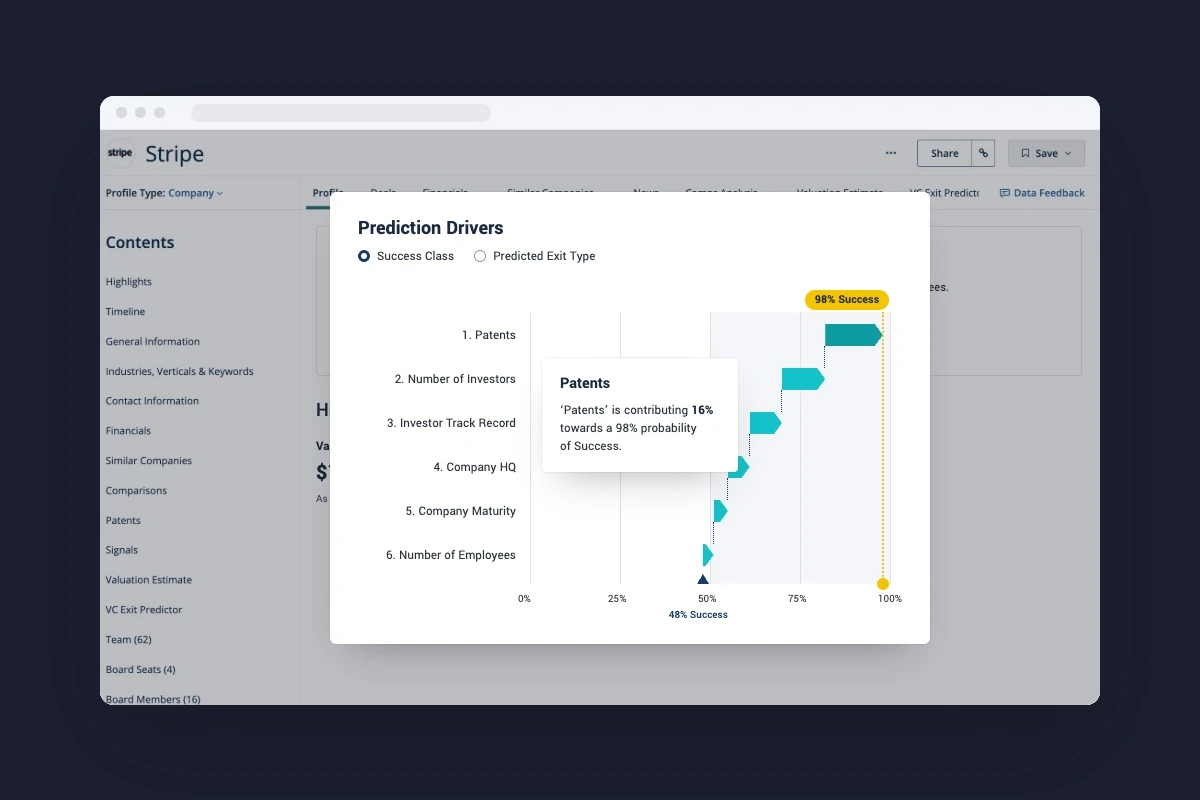
A PitchBook company profile: the AI Profile Summary writes itself, then Prediction Drivers steps from a 48% baseline to a 98% prediction and explains its top driverA PitchBook company profile: the AI Profile Summary writes itself, then Prediction Drivers steps from a 48% baseline to a 98% prediction and explains its top driver

PitchBook, 2023 – 2025

Making PitchBook’s AI explain itself

Customers wanted to know why before using PitchBook’s AI predictions, so I designed explanations, prediction history and profile summaries people could check.

Role
Sr. Product Designer
Partners
Product, ML engineering, research, customer success, sales, data operations, marketing
Timeline
2023 – 2025
Scope
Explainable exit predictions · AI profile summaries

The problem

Customers mostly agreed with the VC Exit Predictor’s forecasts but wanted to know why before acting on them. Company and investor profiles had their own problem: too much data to scan.

The outcome

Prediction drivers and month-by-month history turned a score into something people could check, and AI summaries now open company and investor profiles. People copy them straight into their notes.

Key decisions

  1. Name the drivers in investors’ terms

    With my PM and ML engineering, I grouped the model’s features by theme into a small set of drivers named in investors’ language, trading some nuance for a picture people can read, and designed a waterfall of how each one pushes the prediction up or down.

  2. Show a history, not one score

    The next question was how a prediction got there, so I designed its month-by-month history, letting people check the score against events they know.

  3. Put the summary first, not in Highlights

    I moved the AI summary from Highlights to the top of company and investor profiles, kept it deterministic so it can’t hallucinate, at the cost of insights a freer model might find, and designed a way to flag mistakes that a researcher then checks.

The full study adds

  • Product screens
  • Research behind each decision
  • Trade-offs
  • Results

Private study · Preview

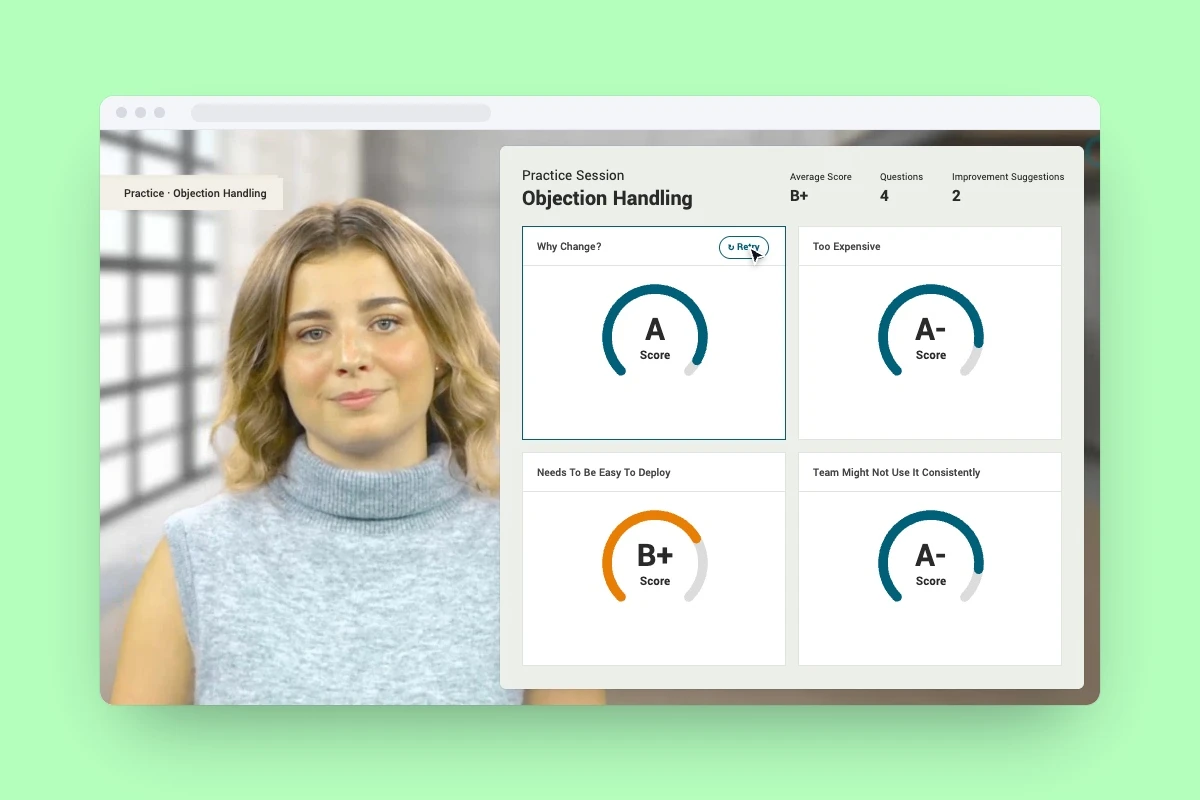
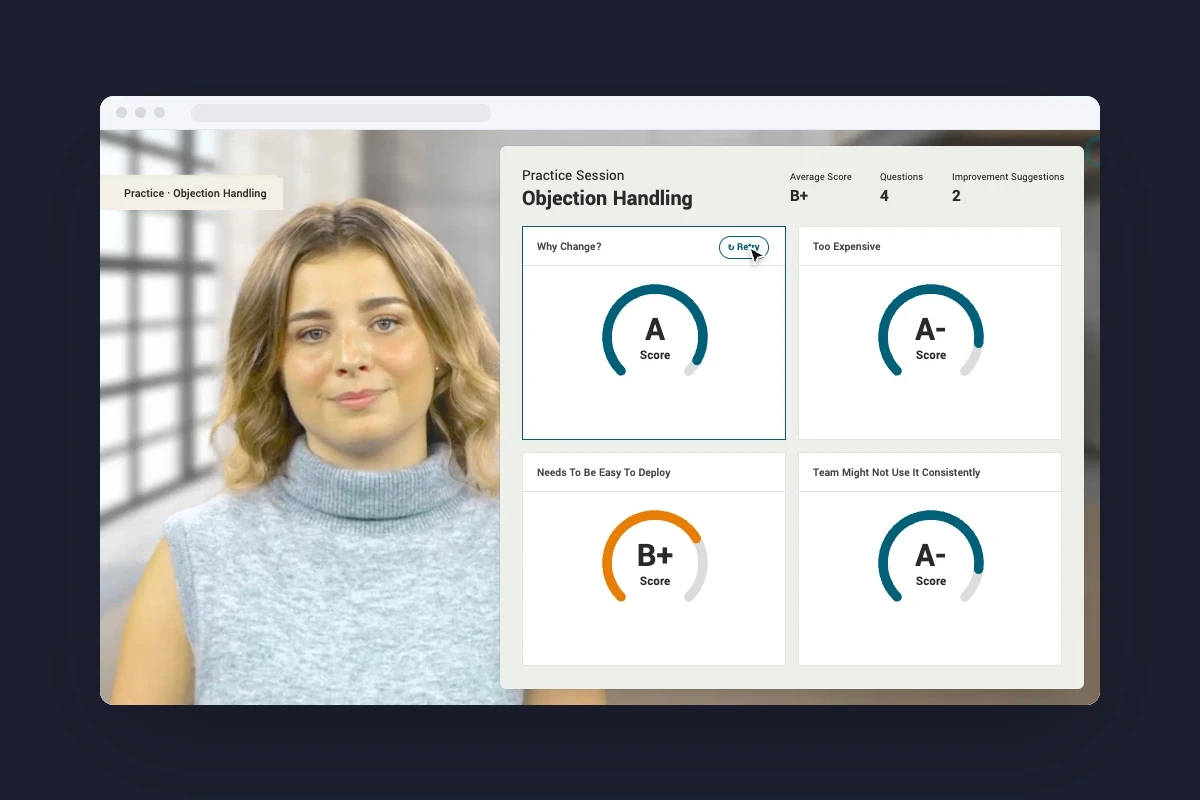
The Quantified simulator: an AI buyer raises an objection, the answer records, the feedback gauges draw with a suggestion, and a retry lifts that score from B+ to AThe Quantified simulator: an AI buyer raises an objection, the answer records, the feedback gauges draw with a suggestion, and a retry lifts that score from B+ to A

Quantified AI × Novartis, 2022 – 2023

AI role-play that helped Novartis onboard reps faster

Novartis had to onboard 150+ sales specialists in nearly half the usual time without more trainers, so I designed an AI role-play simulator for them to practice.

Role
Product Designer
Partners
Engineers and AI researchers
Timeline
Oct 2022 – Feb 2023
Scope
First version of the sales training platform

The problem

Novartis had to onboard a wave of new sales specialists in nearly half the usual time, with field trainers already at capacity.

The outcome

Reps practiced far more than live coaching allowed, onboarding got faster, and most learners passed their verbal assessments on the first attempt.

Key decisions

  1. Practice as a loop, not a test

    Learners practice in a repeatable loop: choose a scenario, role-play with an AI customer, get feedback, retry. It mimics live coaching without the pressure or the scheduling.

  2. Feedback that coaches instead of grades

    With the AI team, I turned qualitative coaching rubrics into feedback tied to the scenario, so a low score comes with a suggestion, not just a number.

  3. Design for safety, not scrutiny

    Learners feared being judged too early, so the interface stays uncluttered, the AI customer is always labeled as AI, and feedback reinforces learning instead of punishing mistakes.

The full study adds

  • Product screens
  • Research behind each decision
  • Trade-offs
  • Results